Weekly Market Commentary | October 14th, 2024
Week in Review…
With all major indices posting positive results, the S&P 500 also ended at a fresh all-time high, closing above 5,800 for the first time. Meanwhile, the Nasdaq is now approximately 1.6% below its July 10 record close. Weekly performance for the week ending October 11, 2024 was:
- The S&P 500 rose 1.11%
- The Dow Jones Industrial Average climbed 1.21%
- The Nasdaq finished the week up 1.31%
- The 10-Year Treasury yield ended the week at 4.094%

The Federal Open Market Committee (FOMC) minutes from the September meeting provided additional context for the Federal Reserve’s decision to implement a 50-bps rate cut. A substantial majority of participants supported this larger cut, viewing it as a recalibration of interest rates rather than an emergency measure. This decision reflects the Fed’s confidence in the progress made towards its inflation goal, while also acknowledging the need to balance risks to both employment and inflation targets.
The release of Consumer Price Index (CPI) data on Thursday was crucial for shaping inflation expectations. Both headline and core CPI came in slightly above forecasts, with headline CPI (September year-over-year (YoY)) at 2.4% and core CPI (September YoY) at 3.3%. These figures suggest that inflation may remain persistent, potentially impacting future rate cut expectations and market pricing.
The impact of sticky inflation expectations was evident in the bond market. The 10-year Note Auction on Wednesday showed a significant increase in interest rates, rising from 3.648% to 4.066% over the past month. Similarly, 30-year bond rates climbed from 4.015% to 4.389%. Consequently, Freddie Mac reported a jump in the average 30-year fixed-rate mortgage to 6.32%, up from 6.12% the previous week. This was not welcomed news in an already sluggish residential housing market.
Two major regulatory decisions made headlines last week. The Department of Justice filed a 32-page document proposing sanctions against Google following its guilty verdict in an antitrust case. These proposed sanctions may have far-reaching implications for other tech giants like Apple, Microsoft, and Amazon. Separately in the banking sector, TD Bank pleaded guilty to violating federal anti-money laundering and bank transparency laws. The bank faces a record-breaking $3.1 billion fine under the Bank Secrecy Act and will have its total assets capped at $434 billion. This penalty underscores the increasing regulatory scrutiny in the financial sector.
Spotlight

Unpacking Factor Performance Year-to-Date in 2024
Factor investing is an investment approach that targets specific drivers of returns across asset classes, known as factors.
Traditional asset allocation typically involves dividing investments among broad asset classes like stocks, bonds, and cash based on an investor’s risk tolerance and goals. In contrast, factor investing goes a step further by focusing on specific attributes within those asset classes that have historically driven return. In other words, practitioners claim that factor investing offers a more granular, systematic approach to portfolio construction by targeting specific return drivers within asset classes, potentially enhancing diversification, risk management, and outperformance compared to traditional asset allocation. The research team had written a snapshot on factor investing in an earlier article that was published on November 27, 2023.

These factors are quantifiable characteristics that can explain differences in stock returns. The main types of factors include:
- Style factors (e.g., value, momentum, quality, size)
- Macroeconomic factors (e.g., economic growth, inflation, interest rates)


Performance Review
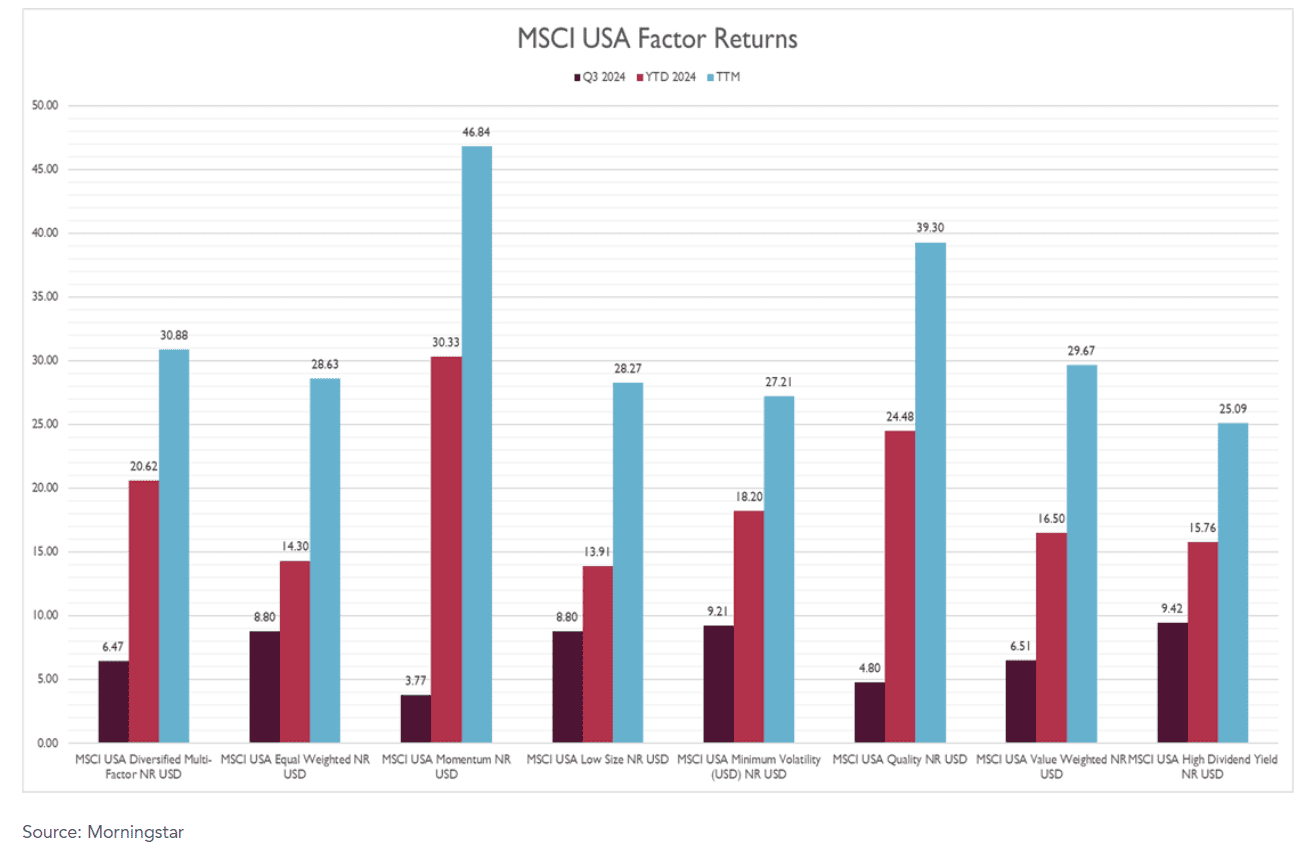
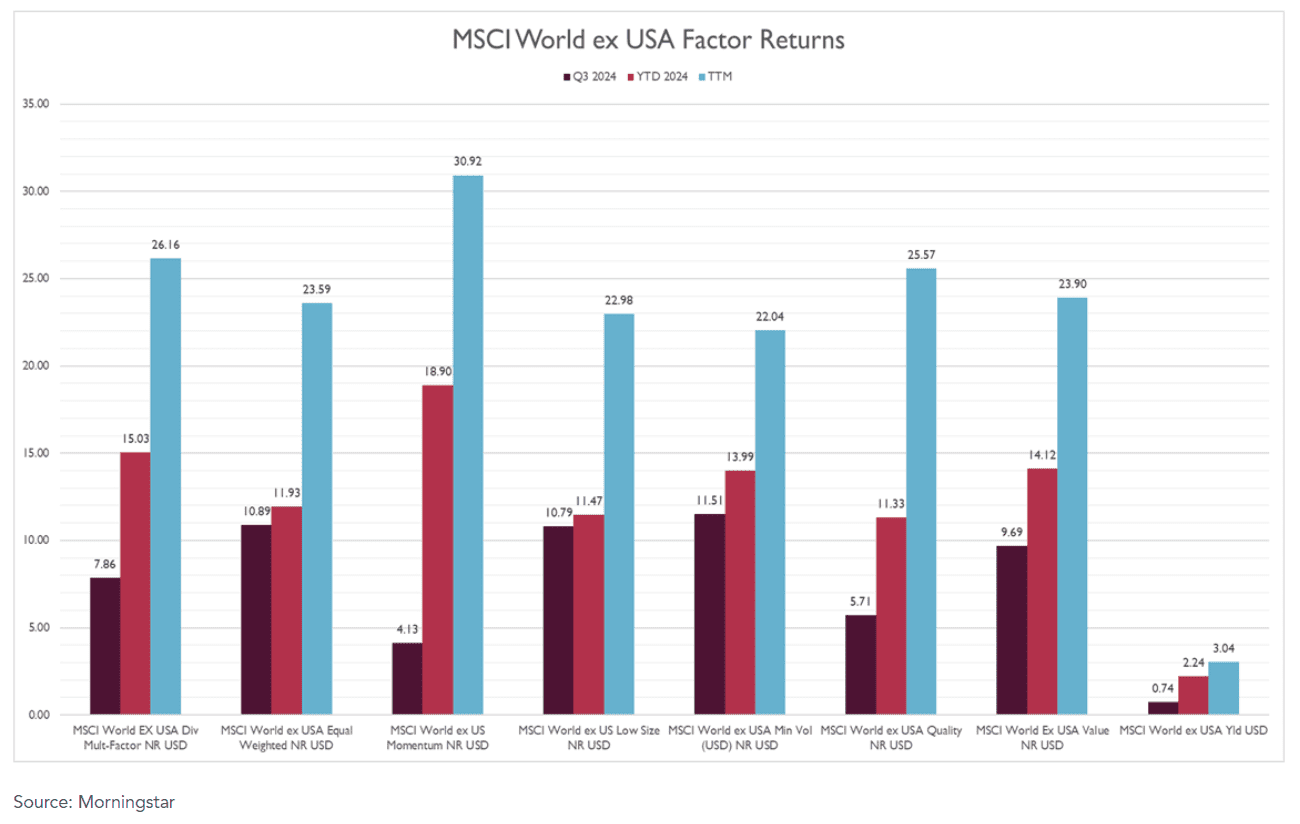
Using the MSCI Factor indices as the basis for performance, the following inferences can be derived:
- MSCI USA Factors
- Top performers:
- Minimum Volatility (Q3: 9.21%)
- Momentum (YTD: 30.33%, TTM: 46.84%)
- Quality (YTD: 24.48%, TTM: 39.30%)
- MSCI World ex USA Factors
- Top performers:
- Minimum Volatility (Q3: 11.51%)
- Momentum (YTD: 18.90%, TTM: 30.92%)
- Underperformer:
- Yield (Q3: 0.74%, YTD: 2.24%, TTM: 3.04%)
- Top performers:
- Top performers:
Key Highlights
MSCI USA Factors Outperform World ex USA Counterparts
The stronger performance of USA factors relative to their World ex USA counterparts suggests:
- Continued strength of the U.S. economy compared to other developed markets
- Possible currency effects favoring U.S. investments
- Differences in sector composition between U.S. and international markets
Momentum: A Standout Factor
- Momentum emerged as a leading factor in both regions, particularly over longer timeframes
- This implies:
- Continuation of existing market trends
- Strong performance in certain sectors and stocks
- Possible concentration in high-growth areas
Minimum Volatility Factors Gain Traction
- Minimum volatility factors performed well in Q3 2024 in both regions
- Strong Q3 performance suggests increased investor preference for lower-risk strategies
- Possible drivers include economic uncertainty, market volatility concerns, and a shift towards defensive positioning
Equal Weighted Indices Show Solid Performance
- Solid performance of equal weighted indices suggests:
- Healthy market breadth
- Possible rotation into mid-sized or small cap companies
Quality Factors Demonstrate Strength
- Quality factors, although moderate in the near term, showed solid performance over the trailing 12 months, particularly in the USA
- This suggests:
- Investor preference for companies with strong fundamentals
- Focus on stable earnings and low debt
- Possible “flight to quality” due to economic concerns
Other Factor Performances
- Value factors performed moderately well, with better returns in World ex USA for Q3
- Low size factors (large and mid-cap companies per MSCI definition) demonstrated strong performance, particularly in World ex USA
- Yield factors significantly underperformed, especially in World ex USA markets
- Potential reasons include:
- Rising interest rates
- Shift away from traditional dividend-paying sectors
- Preference for growth over income
- Potential reasons include:
In today’s investment landscape, factor-based ETF products have become increasingly popular among private wealth investors. These products, provided by prominent asset managers, seek to harness specific factor premiums while ensuring transparency and liquidity. Understanding factor interactions is also crucial for effective portfolio construction, as combining low-correlation factors can potentially improve risk-adjusted returns and reduce underperformance periods. Recent research favors multi-factor approaches over factor timing, a trend observed in both U.S. and international developed markets. While pricier than traditional index funds, factor strategies offer a cost-effective alternative to active management for investors seeking enhanced returns.
Definitions
MSCI Factor indices are designed to capture specific investment characteristics or “factors” that have been shown to drive risk and return in equity markets. These indices are constructed by modifying the weighting scheme of a parent index (e.g., MSCI World or MSCI USA) to tilt towards stocks exhibiting the desired factor characteristics
- Size: Focuses on smaller companies within the parent index
- Value: Targets stocks that appear undervalued based on fundamentals like book value and earnings
- Quality: Emphasizes companies with strong balance sheets, stable earnings, and other “quality” metrics
- Momentum: Aims to capture stocks with strong recent performance
- Minimum Volatility: Seeks to minimize overall portfolio volatility
- Low Size: Assigns higher weights to large and mid-cap companies, often using inverse of the traditional ‘size’ factor defined by Fama French
- Equal Weighted: Allocates the same weight to each constituent in the index
- Diversified Multifactor: Combines multiple factors (e.g., value, momentum, quality) to create a diversified factor exposure
Week Ahead…

Next week’s economic focus will center on demand indicators, with future interest rate speculation playing a secondary role. The health of the U.S. economy and consumer demand will take center stage in the week ahead.
Thursday will bring the release of headline Retail Sales and Core Retail Sales data. Core Retail Sales measures the change in total retail sales value, excluding automobile sales. These reports are crucial indicators of retail consumption strength, which is significant because consumption constitutes a large portion of U.S. gross domestic product (GDP). GDP, in turn, is a key factor in forecasting stock market returns and inflation expectations.
Following last week’s surplus of 5.81 million barrels, the upcoming crude oil inventory report will be closely watched. Oil demand serves as an indicator of overall economic activity, affecting both stock prices and broader economic sentiment. A continued surplus could suggest weakening demand, potentially signaling economic slowdown.
September’s Housing Starts and Preliminary Building Permits will offer insights into both the supply and demand dynamics of the housing market. These metrics are particularly important given the significant leverage involved in construction and home purchases. Strong numbers could indicate economic confidence, while weak figures might suggest caution among investors and buyers due to high interest rates or economic uncertainty.
While not the primary focus, discussions about future interest rates will continue in the background. The market will likely interpret the week’s economic data through the lens of potential Federal Reserve actions, particularly regarding the timing and extent of future rate cuts.
These demand indicators will collectively provide a comprehensive picture of current economic conditions and consumer confidence, helping to shape market expectations for the near future.
This content was developed by Cambridge from sources believed to be reliable. This content is provided for informational purposes only and should not be construed or acted upon as individualized investment advice. It should not be considered a recommendation or solicitation. Information is subject to change. Any forward-looking statements are based on assumptions, may not materialize, and are subject to revision without notice. The information in this material is not intended as tax or legal advice.
Investing involves risk. Depending on the different types of investments there may be varying degrees of risk. Socially responsible investing does not guarantee any amount of success. Clients and prospective clients should be prepared to bear investment loss including loss of original principal. Indices mentioned are unmanaged and cannot be invested into directly. Past performance is not a guarantee of future results.
The Dow Jones Industrial Average (DJIA) is a price-weighted index composed of 30 widely traded blue-chip U.S. common stocks. The S&P 500 is a market-cap weighted index composed of the common stocks of 500 leading companies in leading industries of the U.S. economy. The NASDAQ Composite Index is a market-value weighted index of all common stocks listed on the NASDAQ stock exchange.
